Cybozu0
V2EX  ›  问与答

通过 echarts 绘制双十一销量实时统计图表

  •  
  •   Cybozu0 · Nov 5, 2019 · 2122 views
    This topic created in 2410 days ago, the information mentioned may be changed or developed.

    双十一 echarts是 apache 的一个孵化项目,这次我们利用它的 api,来实现了 kintone 门户页面的双十一的销量实时统计的 Dashboard。
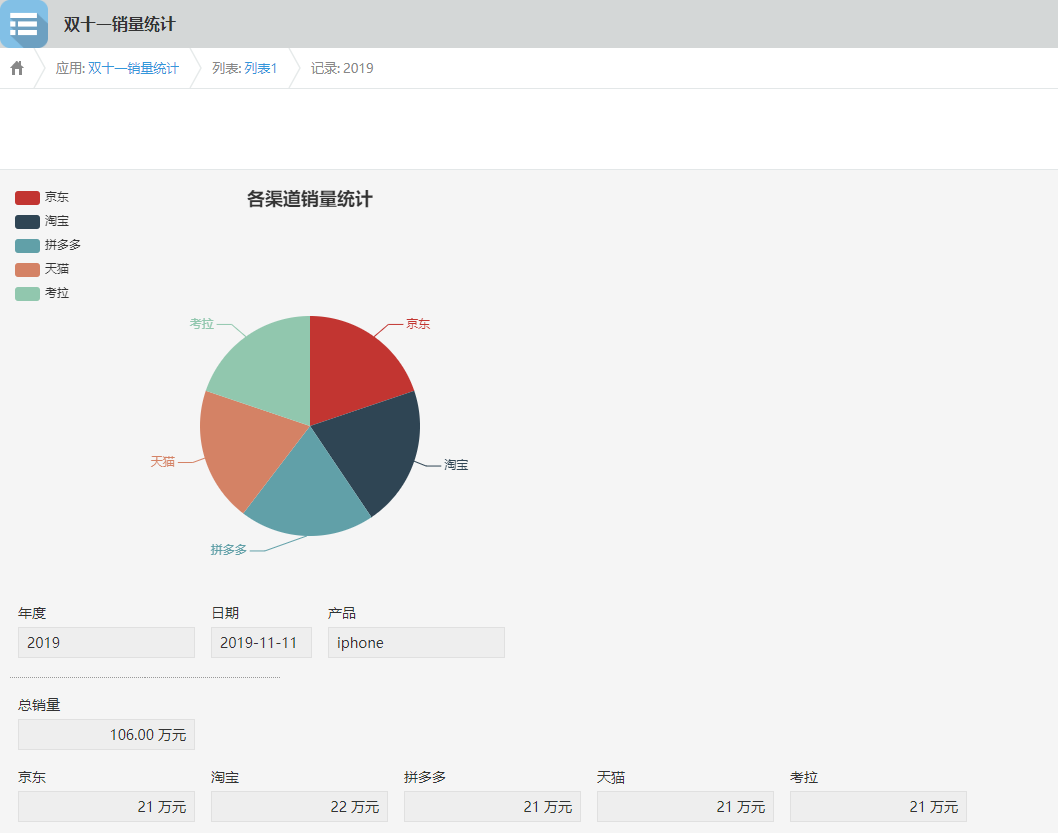
    我们先看下效果图。 效果图

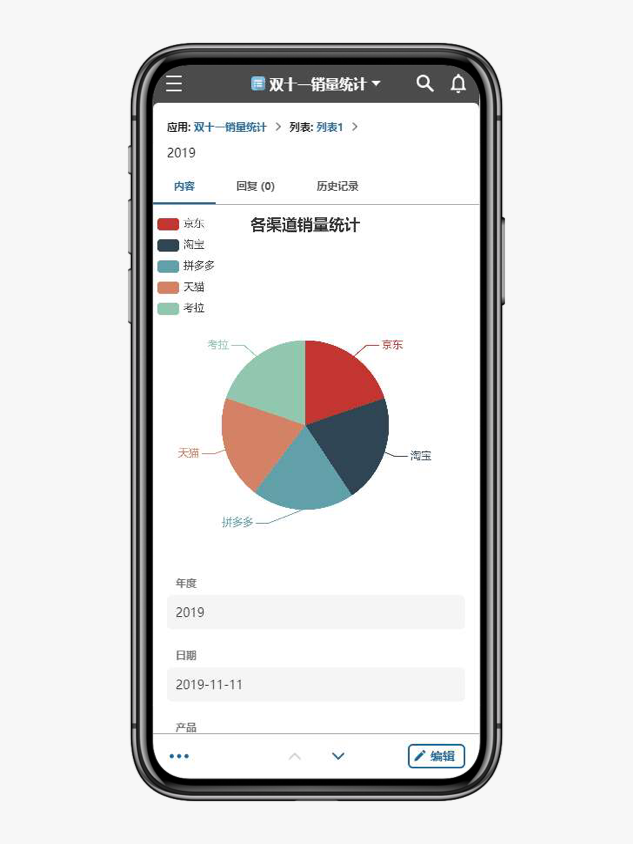
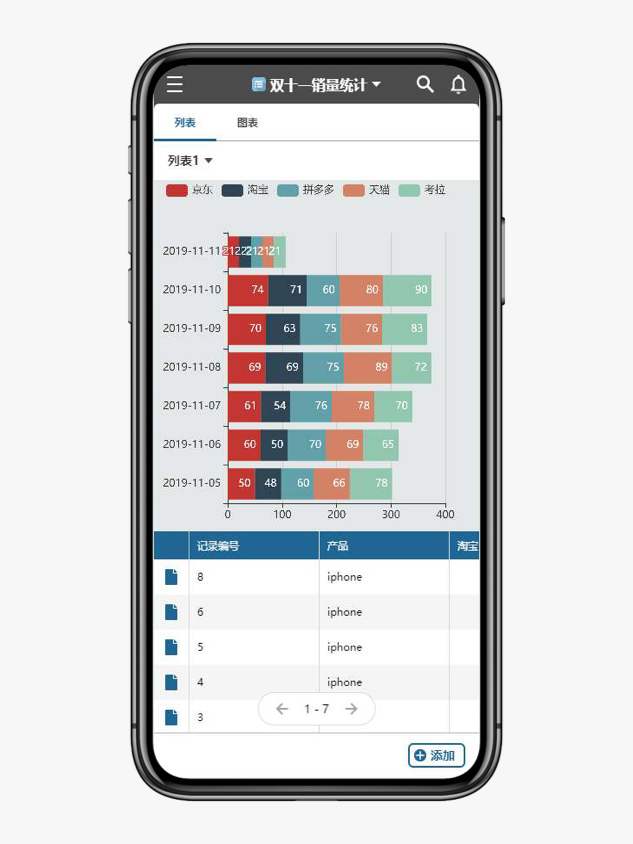
    折线图显示了双十一期间的产品销量走势,而饼图则显示了各渠道的产品销量的占比,同时他们都是实时变化的。 接下来我们就来看下它是怎么实现的。

    公用的库

    下面是我们要用到的库:

    echarts

    kintone JS SDK

    ※ 这里不对这两个库做具体介绍,如果还不熟悉它们,请先参阅相关文档。

    graph.js

    (应用列表页和应用详情页显示绘图的 js,为了方便这边将 pc 端和 mobile 端的代码整合到了一起。)

    (function () {
        'use strict';
        kintone.events.on(['app.record.detail.show', 'app.record.edit.show'], function (res) {
            const pcSetting = {
                type: 'pc',
                showContent: true,
                style: "width: 600px;height:400px;",
            };
            generateDetail(pcSetting, res);
        });
        kintone.events.on(['mobile.app.record.detail.show', 'mobile.app.record.edit.show'], function (res) {
            const mobileSetting = {
                type: 'mobile',
                showContent: false,
                style: "width: 350px;height:400px;",
            };
            generateDetail(mobileSetting, res);
        });
        kintone.events.on(['app.record.index.show'], function (res) {
            const pcSetting = {
                type: 'pc',
                showContent: true,
                style: "width: 900px;height:400px;"
            };
            generateTotal(pcSetting);
        });
        kintone.events.on(['mobile.app.record.index.show'], function (res) {
            const mobileSetting = {
                type: 'mobile',
                showContent: false,
                style: "width: 350px;height:400px;"
            };
            generateTotal(mobileSetting);
        });
        function generateDetail(setting, res) {
            var record = res.record;
            var report_el;
            if (setting.type === "mobile") {
                report_el = kintone.mobile.app.record.getSpaceElement("report");
            }
            else {
                report_el = kintone.app.record.getSpaceElement("report");
            }
            var report_div = document.createElement('div');
            report_div.id = "graph";
            report_div.style = setting.style;
            var myChart = echarts.init(report_div);
            var option = {
                title: {
                    text: '各渠道销量统计',
                    x: 'center'
                },
                tooltip: {
                    trigger: 'item',
                    formatter: "{a} <br/>{b} : {c} ({d}%)",
                    showContent: setting.showContent
                },
                legend: {
                    orient: 'vertical',
                    left: 'left',
                    data: ['京东', '淘宝', '拼多多', '天猫', '考拉']
                },
                series: [
                    {
                        name: '假期类型',
                        type: 'pie',
                        radius: '55%',
                        center: ['50%', '60%'],
                        data: [
                            { value: record.channel1.value, name: '京东' },
                            { value: record.channel2.value, name: '淘宝' },
                            { value: record.channel3.value, name: '拼多多' },
                            { value: record.channel4.value, name: '天猫' },
                            { value: record.channel5.value, name: '考拉' }
                        ],
                        itemStyle: {
                            emphasis: {
                                shadowBlur: 10,
                                shadowOffsetX: 0,
                                shadowColor: 'rgba(0, 0, 0, 0.5)'
                            }
                        }
                    }
                ]
            };
            myChart.setOption(option);
            report_el.appendChild(report_div);
        }
        function generateTotal(setting) {
            if (document.getElementById('graph') !== null) {
                return;
            }
            var graph = document.createElement('div');
            graph.id = 'graph';
            graph.style = setting.style;
            var app;
            if (setting.type === "mobile") {
                kintone.mobile.app.getHeaderSpaceElement().appendChild(graph);
                app = kintone.mobile.app.getId();
            }
            else {
                kintone.app.getHeaderSpaceElement().appendChild(graph);
                app = kintone.app.getId();
            }
            var myChart = echarts.init(graph);
            var kintoneRecord = new kintoneJSSDK.Record();
            var rcOption = {
                app: app,
                query: 'order by date asc'
            };
            kintoneRecord.getAllRecordsByCursor(rcOption).then((rsp) => {
                var records = rsp.records;
                var graphData = { 'channel1': [], 'channel2': [], 'channel3': [], 'channel4': [], 'channel5': [] };
                var dateArray = [];
                for (var record of records) {
                    var dateKey = record.date.value;
                    graphData.channel1.push(record.channel1.value);
                    graphData.channel2.push(record.channel2.value);
                    graphData.channel3.push(record.channel3.value);
                    graphData.channel4.push(record.channel4.value);
                    graphData.channel5.push(record.channel5.value);
                    dateArray.push(dateKey);
                }
                var option = {
                    tooltip: {
                        trigger: 'axis',
                        axisPointer: {
                            type: 'shadow'
                        },
                        showContent: setting.showContent
                    },
                    legend: {
                        data: ['京东', '淘宝', '拼多多', '天猫', '考拉']
                    },
                    grid: {
                        left: '3%',
                        right: '4%',
                        bottom: '3%',
                        containLabel: true
                    },
                    xAxis: {
                        type: 'value'
                    },
                    yAxis: {
                        type: 'category',
                        data: dateArray
                    },
                    series: [
                        {
                            name: '京东',
                            type: 'bar',
                            stack: '总量',
                            label: {
                                normal: {
                                    show: true,
                                    position: 'insideRight'
                                }
                            },
                            data: graphData.channel1
                        },
                        {
                            name: '淘宝',
                            type: 'bar',
                            stack: '总量',
                            label: {
                                normal: {
                                    show: true,
                                    position: 'insideRight'
                                }
                            },
                            data: graphData.channel2
                        },
                        {
                            name: '拼多多',
                            type: 'bar',
                            stack: '总量',
                            label: {
                                normal: {
                                    show: true,
                                    position: 'insideRight'
                                }
                            },
                            data: graphData.channel3
                        },
                        {
                            name: '天猫',
                            type: 'bar',
                            stack: '总量',
                            label: {
                                normal: {
                                    show: true,
                                    position: 'insideRight'
                                }
                            },
                            data: graphData.channel4
                        },
                        {
                            name: '考拉',
                            type: 'bar',
                            stack: '总量',
                            label: {
                                normal: {
                                    show: true,
                                    position: 'insideRight'
                                }
                            },
                            data: graphData.channel5
                        }
                    ]
                };
                myChart.setOption(option);
            }).catch((err) => {
                document.getElementById('graph').innerText = "获取数据失败";
            });
        }
    }());
    

    手机端画面:

    效果图效果图

    pc 端画面:

    效果图

    具体代码包括首页的实时变化数据的图表代码请参考完整文章:

    https://cybozudev.kf5.com/hc/kb/article/1321710/

    No Comments Yet
    About   ·   Help   ·   Advertise   ·   Blog   ·   API   ·   FAQ   ·   Solana   ·   5400 Online   Highest 6679   ·     Select Language
    创意工作者们的社区
    World is powered by solitude
    VERSION: 3.9.8.5 · 47ms · UTC 07:53 · PVG 15:53 · LAX 00:53 · JFK 03:53
    ♥ Do have faith in what you're doing.